In Proceedings of the 7th ACM SIGKDD International Conference on Knowledge Discovery and Data Mining (KDD-2001), August 2001.
Extracting Collective Probabilistic Forecasts from Web Games
David M. Pennock and Steve Lawrence
NEC Research Institute
4 Independence Way
Princeton, NJ 08540 USA
Finn Årup Nielsen
Informatics and Mathematical Modelling
Technical University of Denmark
DK-2800 Lyngby, Denmark
C. Lee Giles
Department of Computer Science and Engineering
Pennsylvania State University
University Park, PA 16801 USA
ABSTRACT
Game sites on the World Wide Web draw people from around the world
with specialized interests, skills, and knowledge. Data from the games
often reflects the players' expertise and will to win. We extract
probabilistic forecasts from data obtained from three online games:
the Hollywood Stock Exchange (HSX), the Foresight Exchange (FX), and
the Formula One Pick Six (F1P6) competition. We find that all three
yield accurate forecasts of uncertain future events. In particular,
prices of so-called ``movie stocks'' on HSX are good indicators of
actual box office returns. Prices of HSX securities in Oscar, Emmy,
and Grammy awards correlate well with observed frequencies of
winning. FX prices are reliable indicators of future developments in
science and technology. Collective predictions from players in the F1
competition serve as good forecasts of true race outcomes. In some
cases, forecasts induced from game data are more reliable than expert
opinions. We argue that web games naturally attract well-informed and
well-motivated players, and thus offer a valuable and oft-overlooked
source of high-quality data with significant predictive value.
ACM Categories and Subject Descriptors
H.2.8 [Database Management]: Database Applications - data mining
H.3.5 [Information Storage and Retrieval]: Online Information Systems-web-based services
J.4 [Computer Applications]: Social and Behavioral Sciences-economics
K.8 [Computing Milieux]: Personal Computing - games
Keywords
Collective probabilistic forecasts, World Wide Web games,
data mining, knowledge discovery, artificial markets, Hollywood Stock
Exchange, Foresight Exchange, Formula One Pick Six Competition
Introduction
Multiplayer games on the World Wide Web are growing in prevalence and
popularity, fueled in part by low operating costs and global
reach. Game players tend to be more knowledgeable and enthusiastic
about their game's topic than the public at large. For example, the
Hollywood Stock Exchange (HSX), a play-money market where traders bet
on the future success of movies and stars, draws heavily from among
film aficionados. In this paper, we investigate the use of such online
games as topic-focused sources of data with relatively high
signal-to-noise ratios, as compared to the web as a whole.
Section 2 discusses background and related work in
exploiting collective knowledge to generate forecasts.
Section 3 describes the three games under
study. Sections 4
and 5 evaluate the collective
competence of HSX players in predicting box office results and
entertainment award outcomes, respectively. In both cases, we find
that HSX forecasts are as accurate or more accurate than expert
judgments. Section 6 shows that prices on the
Foresight Exchange (FX) correlate strongly with observed outcome
frequencies for events of broad scientific and societal
interest. Section 7 examines the Formula One Pick
Six (F1P6) competition, showing that a simple weighting of
participants' predictions seems as reliable or more reliable than even
the official race odds. Section 8 discusses the more
general prospects of mining data and extracting knowledge from a
variety of online games and related sources.
Collective Forecasts
For decades, and across many disciplines, scientists have investigated
combining forecasts from multiple sources. Genest and
Zidek Genest86 and French French85 survey the
extensive literature on combining probability assessments from
multiple experts. Clemen Clemen89 reviews the equally
large (and related) body of work on combining forecasts; most studies
conclude that collective forecasts are indeed more accurate than
individual ones. Some of today's best machine learning methods are
so-called ensemble algorithms that combine classifications from
multiple learners to yield more robust classifications
[7]. Collaborative filtering algorithms or
recommender systems leverage community information about many
people's preferences in order to recommend items of interest (e.g.,
movies or books) to individuals [29].
Markets can also be thought of as combination devices.
Prices reflect information distributed among many traders, each with
direct monetary incentives to act on any pertinent
information. Informative prices often translate directly into accurate
forecasts of future events. For example, prices of financial options
are good probability assessments of the future prices of the
underlying assets [31]; prices in political stock
markets, like the Iowa Electronic Market (IEM),![[*]](footnote.png) can furnish better estimates of likely election outcomes than
traditional polls [11,12]; odds in horse races,
determined solely by how much is bet on which horses, match very
closely with the horses' actual frequencies of winning
[1,30,32,33,35];
and point-spread betting markets yield unbiased predictions of
sporting event outcomes [14]. Several studies demonstrate
that, in a laboratory setting, markets are often able to aggregate
information optimally [10,25,26,27].
In a game without monetary rewards, incentives to reveal information
presumably derive from entertainment value, educational value,
bragging rights, and/or other intangible sources. Our recent
investigations [22,23] conclude
that even market games show signs of collective competence. For
example, arbitrage opportunities on HSX (i.e., loopholes that allow
traders to earn a sure profit without risk) tend to disappear over
time, just as they do in real markets.
Sections 4,
5, and 6 show that
intangible rewards seem sufficient to drive forecast accuracy in
market games. Section 7 presents evidence that,
even without the ``carrot'' of monetary compensation, F1P6 players are
motivated enough to generate very accurate collective predictions of
Formula One racing outcomes.
can furnish better estimates of likely election outcomes than
traditional polls [11,12]; odds in horse races,
determined solely by how much is bet on which horses, match very
closely with the horses' actual frequencies of winning
[1,30,32,33,35];
and point-spread betting markets yield unbiased predictions of
sporting event outcomes [14]. Several studies demonstrate
that, in a laboratory setting, markets are often able to aggregate
information optimally [10,25,26,27].
In a game without monetary rewards, incentives to reveal information
presumably derive from entertainment value, educational value,
bragging rights, and/or other intangible sources. Our recent
investigations [22,23] conclude
that even market games show signs of collective competence. For
example, arbitrage opportunities on HSX (i.e., loopholes that allow
traders to earn a sure profit without risk) tend to disappear over
time, just as they do in real markets.
Sections 4,
5, and 6 show that
intangible rewards seem sufficient to drive forecast accuracy in
market games. Section 7 presents evidence that,
even without the ``carrot'' of monetary compensation, F1P6 players are
motivated enough to generate very accurate collective predictions of
Formula One racing outcomes.
The Games
The Hollywood Stock Exchange
The Hollywood Stock Exchange (HSX)
is a popular online market game, with approximately 400,000 registered
accounts. New accounts begin with H$ two million in ``Hollywood
dollars''. Participants can buy and sell movie stocks, star bonds,
movie options, and award options. The current top portfolio is worth
just over H$1 billion. High ranking portfolios are actually sold at
auction on Ebay for real money on
a regular basis. Based on these sales, the ``exchange rate'' seems to
be approximately H$1 million to US$1, with the rate increasing for
higher ranked portfolios. HSX is beginning to offer new investment
opportunities backed with real money. For example, HSX investors could
purchase shares in the movie American Psycho for H$1 million
each; these shares paid off about US$1 for every US$5 million of the
movie's box office proceeds. HSX cofounder Max Keiser hosts a weekly
radio broadcast in Los Angeles, and appears regularly on NBC's
Access Hollywood to discuss HSX information. HSX also sponsors
a booth at the Sundance Film Festival, and holds an annual Oscar party
in Hollywood. Media reports suggest that HSX prices are taken
seriously by some Hollywood insiders.
Although the current price of any HSX movie stock is based on the
collective whims of HSX traders, the value of the stock is ultimately
grounded in the corresponding movie's performance at the box
office. Specifically, after the movie has spent four weeks in release,
the stock delists and cashes out: shareholders receive H$1 per share
for every US$1 million that the movie has grossed up to that point in
the US domestic market, as reported by ACNielsen EDI,
Inc. Traders buy (resp., short
sell) stocks that they believe underestimate (overestimate) the
movie's eventual performance. The current price, then, is a collective
forecast of the movie's four-week box office
returns.
The prices of some stocks adjust after their first weekend in wide,
national release. On Friday, trading in the stock is halted; on
Sunday, the price adjusts to H$2.9 times the movie's weekend box
office numbers (in US$ millions). In this case, the stock's price
prior to wide release is the HSX traders' forecast of 2.9 times the
movie's opening weekend proceeds. The 2.9 factor is meant to project
the movie's four week total based on its opening weekend results.
Occasionally, HSX offers ``award options'' associated with particular
entertainment awards ceremonies--for example, the 72nd Annual Academy
Awards, or Oscars, sponsored by the Academy of Motion Picture
Arts and Sciences in 2000. Five options, corresponding to the five
award nominees, are available within each award category (for example,
Oscar award options were available for each of the eight major Oscar
categories of best picture, best actor, best actress, best supporting
actor, best supporting actress, best director, best original
screenplay, and best adapted screenplay). Within each category, the
winning option cashes out at H$25, and the other four cash out at
H$0. Before awards are announced, an option's price can be
interpreted as its estimated likelihood of winning. For example, when
Kevin Spacey's price was twice that of Denzel Washington, the
consensus of HSX opinions was that Spacey was roughly twice as likely
to win as Washington. By normalizing prices within each category,
likelihoods can be converted into probabilities.
The Foresight Exchange
Hanson Hanson99,Hanson95 proposes what he calls an
Idea Futures market, where participants trade in securities
that pay off contingent on future developments in science, technology,
or other arenas of public interest. For example, a security might pay
off US$1 if and only if a cure for cancer is discovered by a certain
date. He argues that the reward structure of such a market encourages
honest revelation of opinions among scientists, yielding more accurate
forecasts for use by funding agencies, public policy leaders, the
media, and other interested parties. The concept is operational as a
web game called the Foresight Exchange
(FX). There are
currently on the order of 3000 registered participants and 200 active
claims. Players start with an initial amount of ``FX bucks'' and
receive an allowance every week, up to a certain maximum. Participants
can buy and sell existing claims, or submit their own claims. Each
claim is assigned a judge to arbitrate ambiguous wording, and to
ultimately determine whether the claim is true or not on the judgment
date. Claims range from technical (e.g., FX$1 if and only if an
algorithm for three satisfiability is developed with a particular
runtime complexity by the year 2020) to sociopolitical (e.g., FX$1 if
and only if Japan possesses nuclear missiles by 2020) to irreverent
(e.g, FX$1 if and only if Madonna names her first child Jesus). The
developers of the site intend for the prices of these claims to be
interpreted as assessments of the probabilities of the various events.
The Formula One Pick Six Competition
Formula One (F1) is one of the prime international race car
competitions. Drivers compete in approximately 16 races during a
season, accumulating points according to how well they place within
each race. The sport draws a large and avid following, especially in
Europe. Betting on the sport is also quite popular. A variety of
bookmakers, both online and off, support bets on the outcomes of
individual F1 races and on the results of an entire season. Media
coverage of the sport is fairly extensive, including a variety of
informative websites (e.g., http://www.motorsport.com/).
Formula One Pick Six (F1P6) is an email- and web-based competition for
predicting F1 outcomes. The game has been in existence
for a number of years, and currently has several thousand registered
participants. No monetary reward is associated with the F1P6
competition. The goal is to correctly forecast the top six drivers of
each race. Participants receive a score based one how well their
ranking of drivers matches the actual result. For each correct
driver-place prediction, they receive 10 points. For each driver
prediction that is one place off, they receive 6 points. For each
driver prediction that is 2, 3, 4, or 5 places off, they receive 4, 3,
2, or 1 points, respectively. Drivers that finish in seventh place and
below are disregarded. Wasserman [34] describes
statistical analyses of the first three years (1994-1996) of the
competition.
Box office forecasts: HSX movie stocks
In this section, we evaluate HSX movie box office forecasts according
to several error metrics. We also investigate the benefit of augmenting
game data with outside information to boost prediction quality.
Recall that, before a movie's opening weekend, its price on HSX is an
estimate of 2.9 times its weekend proceeds. We collected the halt
prices  (Friday morning's prices) and adjust prices
  (2.9
times the actual return) from HSX for 50 movies opening during the
period March 3, 2000 to September 1, 2000.
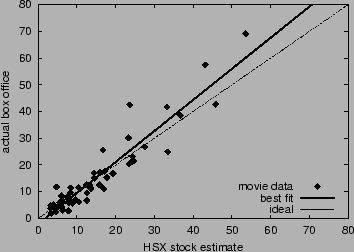
Figure 1 plots the actual box
office return
(2.9
times the actual return) from HSX for 50 movies opening during the
period March 3, 2000 to September 1, 2000.
Figure 1 plots the actual box
office return  versus the HSX estimate
  for each
movie. We measure accuracy of the forecasts according to four metrics:
(1) correlation between estimate and actual, (2) average absolute
error, (3) average percent error, and (4) slope of the best-fit line
to the data.
Table 1 reports these error
measurements for baseline HSX data. Without any preprocessing (e.g.,
boosting, filtering, or learning), HSX forecasts are remarkably
accurate. Game players--at least collectively--appear to be
knowledgeable about the prospects of upcoming movies and are
sufficiently well-motivated to reveal their information in the context
of the game, even without much prospect for tangible compensation.
for each
movie. We measure accuracy of the forecasts according to four metrics:
(1) correlation between estimate and actual, (2) average absolute
error, (3) average percent error, and (4) slope of the best-fit line
to the data.
Table 1 reports these error
measurements for baseline HSX data. Without any preprocessing (e.g.,
boosting, filtering, or learning), HSX forecasts are remarkably
accurate. Game players--at least collectively--appear to be
knowledgeable about the prospects of upcoming movies and are
sufficiently well-motivated to reveal their information in the context
of the game, even without much prospect for tangible compensation.
Figure 1:
Accuracy of HSX movie stock forecasts to predict opening
weekend box office returns. The dashed line corresponds to ideal accuracy;
the solid line is the best linear fit.
 |
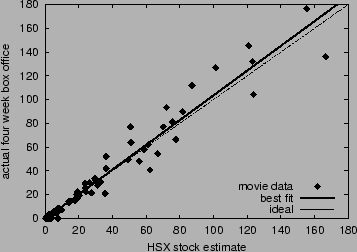
Next, we evaluate HSX predictions of four-week total box office
proceeds. After a movie stock on HSX adjusts (or if it does not
adjust), its price becomes a forecast of the movie's four-week box
office total  . We gathered the delist prices and the prices
three weeks before delist
. We gathered the delist prices and the prices
three weeks before delist  for 109 movies between March 3, 2000
to September 1, 2000. Figure 2
graphs versus for each movie. The correlation is 0.978,
the best-fit line's slope is 1.04, and the average error is 4.01. The
average percent error is undefined (infinite), since a few small
movies apparently did not earn any measurable amount of money.
for 109 movies between March 3, 2000
to September 1, 2000. Figure 2
graphs versus for each movie. The correlation is 0.978,
the best-fit line's slope is 1.04, and the average error is 4.01. The
average percent error is undefined (infinite), since a few small
movies apparently did not earn any measurable amount of money.
Figure 2:
Accuracy of HSX movie stock forecasts to predict four week total
box office returns. The dashed line corresponds to ideal
accuracy; the solid line is the best linear fit.
 |
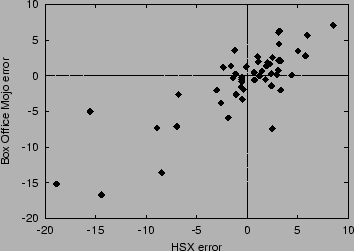
We also recorded the forecasts of opening weekend returns from movie
expert Brandon Gray of Box Office Mojo. Table 1
compares the accuracy of Box Office Mojo predictions to HSX
predictions. The two forecasts are of comparable quality--Box Office
Mojo performed 4% better than HSX in terms of average percent
error. In fact, the two sources make similar
errors. Figure 3 plots the correlation between
HSX errors and Box Office Mojo errors. Both sources overestimate a
larger fraction of movies; but when they do underestimate, they are
off by a greater amount. This occurs because both tend to
underestimate the best box office performers. The correlation in
errors between HSX and Box Office Mojo is 0.818. The two estimates may
result from overlapping sources of evidence--for example, it is
possible that Brandon Gray observes HSX prices, and/or that some HSX
traders read Box Office Mojo forecasts.
Figure 3:
Correlation between HSX opening weekend forecast errors and
Box Office Mojo forecast errors.
 |
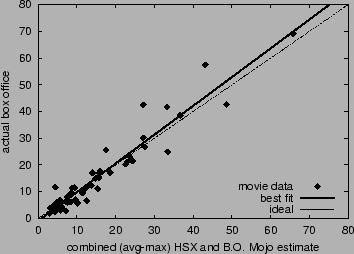
We investigate combining data from HSX and Box Office Mojo to sharpen
predictions. The simplest method--averaging the two
estimates--results in increased correlation, decreased average error,
and decreased percent error, as reported in
Table 1. Since both sources
underestimate big box office winners, we tried a second combination
procedure that returns the average of the two forecasts if that
average is less than twenty-five, otherwise returning the maximum of
the two forecasts. This ``avg-max'' combination gave the most accurate
predictions according to all four metrics (see
Table 1). Figure 4
graphs box office numbers versus this combined estimate. Without more
data, we hesitate to employ more sophisticated learning and boosting
techniques lest we begin to overfit; on the other hand, given access
to training and test data over a larger time frame, such methods will
likely become warranted.
Table 1:
Accuracy of HSX, Box Office Mojo, and combined forecasts of
opening weekend box office returns. Accuracy metrics are
correlation, average error, average percent error, and slope of
the least-squares best-fit line.
| |
corr |
avg err |
avg %err |
fit |
| HSX |
0.940 |
3.57 |
31.5 |
1.16 |
| BOMojo |
0.945 |
3.31 |
27.5 |
1.10 |
| avg |
0.950 |
3.16 |
27.0 |
1.15 |
| avg-max |
0.956 |
2.90 |
26.6 |
1.08 |
Figure 4:
Accuracy of combined HSX and Box
Office Mojo forecasts to predict opening
weekend box office returns. The dashed line
corresponds to ideal accuracy;
the solid line is the best linear fit.
 |
Combining forecasts works best when individually accurate sources make
uncorrelated errors [7]. Since HSX and Box Office Mojo
exhibit dependent errors, the gain from merging data, while
appreciable, is relatively small. Identifying alternative sources that
yield independent forecasts will be a key component of any data
combination strategy. Some candidate sources to explore include chat
board postings, query logs, press coverage, movie reviews, and link
structure on the web.
Entertainment Award Forecasts: HSX Award Options
In the 2000 HSX Oscar options market, as it turns out, each nominee
with the highest final price in its category did indeed win an Oscar.
The Wall Street Journal, amid controversy, published a poll of actual
Academy voters days before the Oscar awards ceremony; their report
correctly forecasted only seven out of eight winners.
Beyond predicting the most likely winner, we investigate how
accurately HSX award option prices reflect all likelihoods of
winning. For example, if prices are accurate, then among all options
with a normalized price of H$0.1, about one in ten should end up
winning. Our accuracy analysis is similar to that conducted for horse
races
[1,30,32,33,35]
and other sports betting markets involving real money. We collected
prices of award options associated with the 2000 Oscars,
Grammies, and Emmies, for a total of
135
options. Grammy options (nine categories) and Emmy options (ten
categories) functioned exactly as Oscar options, though winning Grammy
options paid out H$42 instead of H$25.
Figure 5:
Accuracy of the HSX award options market. Points display
observed frequency versus average normalized price for buckets of
similarly-priced options. The dashed line where frequency equals
price corresponds to ideal accuracy.
![\begin{figure}
\begin{center}
\centerline{\scalebox{0.65}{\epsfig{file=hsx-a...
...udegraphics[width=14cm]{hsx-oscar-arbitrage.eps}
\end{center}
\end{figure}](img11.png) |
Prices were recorded just before the markets closed, and before
winners were announced. We sorted the options by price, and grouped
them into six buckets. We placed the same number of options (16)
in every bucket, under the constraint that every bucket include at
least one winning option. We computed the average normalized price of
options within each bucket, and the observed frequency within
each bucket, or the number of winning options divided by the number of
options. Figure 5 plots each
bucket's observed frequency versus its average normalized price. If we
model options as independent Bernoulli trials, then, in the limit as
the number of options goes to infinity, completely accurate prices
would imply that bucket points fall on the line  , where observed
frequency equals price. Error bars display 95% confidence intervals
under the independent Bernoulli trials assumption. Specifically, the
lower error bound is the 0.025 quantile of a Beta distribution
corresponding to the observed number of successes (wins) and trials in
the bucket, and the upper error bound is the 0.975 quantile. The Beta
distribution is the correct posterior distribution over frequency,
assuming a uniform prior. The length of an error bar decreases as the number of
options in the bucket increases. The independence assumption is an
idealization, since options within a single award category are
actually mutually exclusive. The closeness of fit to the line
can be considered a measure of the accuracy of HSX prices.
, where observed
frequency equals price. Error bars display 95% confidence intervals
under the independent Bernoulli trials assumption. Specifically, the
lower error bound is the 0.025 quantile of a Beta distribution
corresponding to the observed number of successes (wins) and trials in
the bucket, and the upper error bound is the 0.975 quantile. The Beta
distribution is the correct posterior distribution over frequency,
assuming a uniform prior. The length of an error bar decreases as the number of
options in the bucket increases. The independence assumption is an
idealization, since options within a single award category are
actually mutually exclusive. The closeness of fit to the line
can be considered a measure of the accuracy of HSX prices.
We compare HSX prices of Oscar options to reported likelihood
assessments from five columnists at the Hollywood Stock Brokerage and
Resource (HSBR), a fansite of
HSX. We use the logarithmic scoring rule to rate the market and the
columnists. The logarithmic score is a proper scoring rule
[36], and is an accepted method of evaluating probability
assessors. When experts are rewarded according to a proper score, they
can maximize their expected return by reporting their probabilities
truthfully. Additionally, more accurate experts can expect to earn a
higher average score than less competent experts. Scores are computed
separately within each award category, then averaged. Index the five
nominees in a category
 . Let
. Let  if and only if
the
if and only if
the  th nominee wins, and
  otherwise. let
 be the market's or columnist's reported probabilities for the
five nominees. Then the assessor's score for the current category is
be the market's or columnist's reported probabilities for the
five nominees. Then the assessor's score for the current category is
 . Expert assessments were
reported on February 18,
2000. Table 2 gives the average
scores for the HSX market, the five columnists, and the consensus of
the columnists. Higher scores are better, with 0 the maximum and
negative infinity the minimum. Only one of the five experts scored
appreciably better than the market on February 18. HSX's score
increased almost continuously from the market's open on February 15 to
the market's close on March 26. By February 19, the market's score had
surpassed all of the scores for all five experts and for their
consensus.
. Expert assessments were
reported on February 18,
2000. Table 2 gives the average
scores for the HSX market, the five columnists, and the consensus of
the columnists. Higher scores are better, with 0 the maximum and
negative infinity the minimum. Only one of the five experts scored
appreciably better than the market on February 18. HSX's score
increased almost continuously from the market's open on February 15 to
the market's close on March 26. By February 19, the market's score had
surpassed all of the scores for all five experts and for their
consensus.
Table 2:
Accuracy of HSX Oscar forecasts and
HSBR columnists' forecasts, evaluated
according to average logarithmic score.
Higher (less negative) scores are better.
| forecast source |
avg log score |
| Feb 18 HSX prices |
-1.08 |
| Feb 19 HSX prices |
-0.854 |
| Tom |
-1.08 |
| Jen |
-1.25 |
| John |
-1.22 |
| Fielding |
-1.04 |
| DPRoberts |
-0.874 |
| columnist consensus |
-1.05 |
Science and Technology Forecasts: The Foresight Exchange
Like HSX award options, FX prices constitute collective probability
assessments of future events. To determine how accurate these
assessment are, we collected historical price information for all
retired (completed) claims as of September 8, 2000. Of these, we
retained only the 172 that were binary (i.e., paid off if and only if
some true-or-false event occurred).
We recorded the price of each claim 30 days before it expired. A total
of 161 claims were active for at least 30 days, and thus qualified for
this data set. We sorted the claims by their 30-day-before-expiration
price, grouped them into six buckets of size 17 (under the constraint
that every bucket contain at least one winning claim), and computed
the average price and observed frequency for each bucket.
Figure 6:
Accuracy of the Foresight Exchange market. Prices are 30
days before claim expiration. Points display observed frequency
versus average price. The dashed line corresponds to ideal
accuracy.
![\begin{figure}
\begin{center}
\centerline{\scalebox{0.65}{\epsfig{file=if-ac...
...udegraphics[width=14cm]{hsx-oscar-arbitrage.eps}
\end{center}
\end{figure}](img23.png) |
Figure 6
graphs the results. Prices correlate well with observed outcome
frequencies.
Error bars show 95% confidence intervals based on the assumption that
claims are independent Bernoulli trials with a uniform prior over
frequency.
Formula One Forecasts: F1P6
The reward structure in the F1P6 competition is quite different than
in HSX, FX, or the F1 betting market. Correctly predicting an
improbable event yields no more points than correctly predicting a
likely event. One might expect that competitors would consistently
choose the six most probable winners. But this strategy may not always
be optimal. By choosing only the best drivers, a participant is not
likely to differentiate himself or herself from the pack (unless
everyone reasons this way). For example, Kaplan and Garstka
Kaplan01 show that, under some conditions, picking the top
seeds in an NCAA basketball tournament pool does not always maximize
the chances of winning. Moreover, when no money is involved, a player
may not gain much sense of accomplishment when he or she simply picks
the top six drivers, even if he or she does win. Thus, the nature of
the competition may induce some strategic incentives to carefully pick
a few upsets.
Figure 7:
For each race in 1999, the fraction of F1P6 participants
that predicted Michael Schumacher to win.
Dots near the top of the chart indicate the races
that he actually competed in.
![\begin{figure}
\begin{center}
\centerline{\scalebox{0.45}{\epsfig{file=Finn-...
...udegraphics[width=14cm]{hsx-oscar-arbitrage.eps}
\end{center}
\end{figure}](img24.png) |
Individuals in the competition are not always fully informed and
rational. For example, when one of the best drivers--Michael
Schumacher--was absent from some races due to injury, several of the
F1P6 players continued to pick him to win. Figure 7 shows
the races that Schumacher competed in during 1999, and the fraction of
participants that predicted him to win. The observed behavior may be
due to a lack of information, or because players skip races, in which
case their previous predictions are carried over. However, carry-over
occurs only once.
Although individuals clearly make faulty predictions, we examine
whether collective information in the game is sufficient to yield
accurate overall predictions. We obtained the predictions of all F1P6
participants from the competition web site for 32 of 41 races held
from 1999 through June 10, 2001. Unlike the other two games investigated, F1P6
does not contain a natural ``price'' statistic that summarizes the
consensus of opinions of all participants. In an attempt to identify a
good summary statistic, we tried four different ways of scoring the
drivers according to the participants' predictions.
- linear scoring (6-5-4-3-2-1)
- F1-style scoring (10-6-4-3-2-1)
- flat scoring (1-1-1-1-1-1)
- winner scoring (1-0-0-0-0-0)
For example, linear scoring assigns to a driver six points for every
F1P6 participant that predicts that driver to finish in first place,
five points for every participant that predicts the driver to finish in
second, and so on. We normalized drivers' scores to obtain a
pseudo-probability associated with each scoring rule.
We collected the actual race results from Atlas F1 and Gale Force F1. We sorted driver-races by score, grouped them
into buckets of constant size, and computed the average scores and
observed frequencies in all buckets. To control against data snooping,
we performed an initial analysis on the 1999 races only. On this data,
linear scoring performed best, with F1-style scoring a close second;
flat scoring and winner scoring performed poorly. The remainder of
results in this section refer to all races from 1999 through June 10,
2001. Figure 8 plots the bucket points
obtained from linear scoring. Error bars are 95% confidence
intervals, under the independent Bernoulli trials assumption. The
figure indicates that linear scores are good estimates of the actual
frequencies of race outcomes. Figure 9 shows
the accuracy of F1-style scoring; this method also appears to yield
accurate psuedo-probabilities. Figures 10
and 11 display the same plots for flat
scoring and winner scoring, respectively; neither of these scoring
methods perform well. These results are consistent with our initial
1999-only analysis, providing a measure of confidence that results are
robust.
Figure 8:
Accuracy of the F1P6 competition.
Points display observed frequency versus linear score.
The dashed line corresponds to ideal accuracy.
![\begin{figure}
\begin{center}
\centerline{\scalebox{0.65}{\epsfig{file=f1-li...
...udegraphics[width=14cm]{hsx-oscar-arbitrage.eps}
\end{center}
\end{figure}](img25.png) |
Figure 9:
Observed frequency versus F1-style score.
![\begin{figure}
\begin{center}
\centerline{\scalebox{0.65}{\epsfig{file=f1-lo...
...udegraphics[width=14cm]{hsx-oscar-arbitrage.eps}
\end{center}
\end{figure}](img26.png) |
Figure 10:
Observed frequency versus flat score.
![\begin{figure}
\begin{center}
\centerline{\scalebox{0.65}{\epsfig{file=f1-fl...
...udegraphics[width=14cm]{hsx-oscar-arbitrage.eps}
\end{center}
\end{figure}](img27.png) |
Figure 11:
Observed frequency versus winner score.
![\begin{figure}
\begin{center}
\centerline{\scalebox{0.65}{\epsfig{file=f1-wi...
...udegraphics[width=14cm]{hsx-oscar-arbitrage.eps}
\end{center}
\end{figure}](img28.png) |
In the case of F1 racing, we have access to a real-money
market--namely the F1 betting market--that naturally lends itself to
comparison with the F1P6 game results. We collected archive betting
odds from Atlas F1 for 39 of 41 races held from 1999 through June 10,
2001.
The odds do not reflect a balanced market, since gamblers can only bet
for a particular driver, not against. In order to ensure a profit,
bookmakers purposefully set the odds such that the corresponding
probabilities sum to greater than one. We found the average excess
probability to be 0.23. We normalized the odds, although it is
possible that bookmakers overstate probabilities in some nonlinear
way. There are some symmetric gambles available, where bettors choose
which of two drivers will fare better. These bets had smaller excess
probabilities (about 0.05), but there were not enough to determine
probabilities across the entire field of drivers. Again, we sorted by
probability (normalized odds), binned the data (in buckets of constant
size), and computed average probability and observed frequency.
Figure 12 graphs the results along with 95%
confidence error bars.
Figure 12:
Accuracy of the bookmaker odds from Atlas F1.
Points display observed frequency versus normalized odds.
![\begin{figure}
\begin{center}
\centerline{\scalebox{0.65}{\epsfig{file=f1-at...
...udegraphics[width=14cm]{hsx-oscar-arbitrage.eps}
\end{center}
\end{figure}](img29.png) |
Table 3 compares the average logarithmic score
for the four types of F1P6 psuedo-probabilities and for the F1 betting
odds, computed over the 30 races for which our data sets
overlap. Perhaps surprisingly, F1-style scoring and linear scoring
outperformed the official odds, if only slightly. Note, however, that
the bookmaker odds may be purposefully biased in a nonlinear fashion.
Table 3:
Accuracy of psuedo-probabilities from
F1P6 and normalized odds from Atlas F1, evaluated
according to average logarithmic score.
Higher (less negative) scores are better.
| forecast source |
avg log score |
| F1P6 linear scoring |
-1.84 |
| F1P6 F1-style scoring |
-1.82 |
| F1P6 flat scoring |
-2.03 |
| F1P6 winner scoring |
-2.32 |
| Atlas F1 normalized odds |
-1.86 |
It is interesting to note that the pattern of results for F1-style
scoring (Figure 9) is very similar to that for
the betting odds (Figure 12). Ideally, we
would like a model of prediction strategies [19] and race
outcomes that explains why F1-style scoring mimics the odds, why
F1-style and linear scoring yield good predictions, and why the other
two scoring methods fail. At this point, however, we have not
formalized any explanations.
We tested only four scoring rules among a class of six dimensional
weighted averaging rules, in part to avoid overfitting our limited
data. With more training and test data, learning the vector of
weights, or learning other functional mappings from F1P6 votes to
psuedo-probabilities, begins to make sense. One might also explore
combining F1P6 and betting odds data, or combining with data from
other games, web sites, or other sources.
Data Mining from Online Games: Implications and Applications
A growing number of games and markets on the web provide vast amounts
of data reflecting the interactions of millions of people around the
world. Each source offers the opportunity to infer something about the
players involved and the knowledge they possess. Data mining
algorithms--typically fast algorithms for extracting knowledge from
massive quantities of data [8,28]--seem
particularly well suited for the job. In this work, we employed simple
extraction algorithms to obtain probabilistic forecasts of real-world
events. Our results can be seen as statistical validation of the
underlying quality of data from online games. The games themselves
appear to serve as a mechanism for collecting, merging, and cleaning
data from human experts, naturally handling some of the more difficult
steps in a typical data mining application [4,20]. Yet
we expect room for improvement with the use of more sophisticated
algorithms and data fusion techniques.
For example, with access to user-specific data, predictions could be
improved by weighting users according to inferred measures of
reliability or expertise, filtering out ``noisy'' users, and
identifying and removing users attempting to manipulate the game. Game
forecasts could also be boosted with information from outside
sources. For example, baseline HSX box office predictions could
benefit from additional data from expert forecasts, statistical
sampling, critical reviews, actor popularity, advertising budgets,
number of screens playing, discussion boards, newsgroups, search
queries [2], distribution of inbound hyperlinks
pointing to movie homepages, web community sizes [9], etc.
More detailed analysis of game dynamics can actually lead to
algorithms for identifying and pinpointing the introduction of new
knowledge into the public consciousness. For example, in August 1996,
the rapid increase in the price of a bet on FX that extraterrestrial
life will be discovered can be traced to
news at the time that fossils were potentially identified in a Martian
meteorite [21]. Similarly, two sequential decreases in the
price of a bet on the (real-money) Iowa Electronic Market that Rudy
Giuliani will win the 2000 US Senate election in New York can be
correlated with two announcements during his campaign: first that he
had prostate cancer, and later that he was dropping out of the race.
In non-market games like F1P6, generating probabilistic forecasts
requires more explicit data manipulation, since a natural price
statistic is not available. In this paper, we tried weighted voting
procedures as a first step, finding that a linear combination seems to
work well, though more advanced machine learning and data mining
techniques are certainly applicable. Additionally, with a model of how
people play the game [19], one can infer the maximum
likelihood opinion of each user, then combine results using known
belief or forecast aggregation methods [3,15].
Inevitably, multiple sites will focus on interrelated topics, and
extraction algorithms will benefit from combining data sources while
accounting for correlations. More general online communities, for
example chat boards or newsgroups, feature some of the same benefits
as game sites--namely dedicated and knowledgeable participants often
willing to divulge information--though leveraging this more free-form
data will require more complex processing algorithms.
An obvious path for applications is to mine information from existing
games. Alternatively, organizations may set up their own online games
as a mechanism for gathering data on particular subjects of interest
or concern, perhaps as an alternative to costly market research
[16]. While Internet polls are notoriously skewed
toward an unrepresentative (more educated, more wealthy, more
conservative) demographic, it appears that web games actually benefit
from the bias within their niche audiences. Perhaps the difference
arises because, while polls typically ask questions of the form ``what
do you want?'', these games pose questions of the form ``what do you
think will happen?'' to an attentive and knowledgeable
audience. However, if corporations begin to take game data seriously,
players may feel wary about privacy issues and what information they
are revealing for free and to whom. Moreover, once data is being used
for consequential decisions, incentives to manipulate the game
increase, and good mechanisms for filtering or controlling
manipulation will be essential.
The World Wide Web fosters large-scale group activities of all sorts,
from competing in games, to trading in markets, to competing in market
trading games. We find that, beyond their entertainment and
commercial value, these sites can be valuable resources for inferring
predictions about real-world events. We show that HSX prices are
informative signals for movie box office results and entertainment
award outcomes--as accurate or more accurate than expert opinions. FX
prices reliably forecast true outcome frequencies for scientific and
societal questions. The combined judgments of F1P6 competitors are
equally or better aligned with actual race outcomes than the official
betting odds.
In both economics [24] and decision science
[6,36] it is known that appropriate monetary
reward structures can induce people to reveal their inside information
and expert knowledge. Our results provide evidence that well-designed
games also provide sufficient incentives for people to divulge their
information. In this context, the players' motivations derive from
their competitive spirit and the value of entertainment, rather than
directly from consumable (e.g., monetary) compensation. In all three
games studied, participants appear to be (collectively) knowledgeable,
and to take winning seriously enough to reveal that knowledge
indirectly through their play. Such online games act as a sink for
specialized information from experts. We believe that, in contrast to
the low signal-to-noise ratio on web as a whole, many online games are
good sources for targeted mining of pertinent and useful data.
We thank Yan Chen, Gary Flake, Robin Hanson, Chris Meek, Forrest
Nelson, Melissa Perrot, William Walsh, Mike Wellman, and the anonymous
reviewers for advice, encouragement, insightful comments, and pointers
to related work. Thanks to Eric Glover for research and programming
assistance. Thanks to James Pancoast and ``Jimmy Impossible'' from the
Hollywood Stock Brokerage and Resource (http://www.hsbr.net/), a
fansite of HSX; Ken Kittlitz from the Foresight Exchange; Paul
Winalski and John Francis from the F1P6 competition; and João Paulo
Lopes da Cumba from the Formula One Results and Information eXplorer
(http://www.forix.com/).
- 1
-
M. M. Ali.
Probability and utility estimates for racetrack bettors.
Journal of Political Economy, 85(4):803-816, 1977.
- 2
-
D. Beeferman and A. Berger.
Agglomerative clustering of a search engine query log.
In Sixth International Conference on Knowledge Discovery and
Data Mining, pages 407-416, 2000.
- 3
-
R. T. Clemen.
Combining forecasts: A review and annotated bibliography.
International Journal of Forecasting, 5:559-583, 1989.
- 4
-
W. W. Cohen, H. Kautz, and D. McAllester.
Hardening soft information sources.
In Sixth International Conference on Knowledge Discovery and
Data Mining, pages 255-259, 2000.
- 5
-
Weighted least sum of squares regression.
In C. Croarkin, P. Tobias, and W. Guthrie, editors, NIST/SEMATECH Engineering Statistics Internet Handbook.
http://www.itl.nist.gov/div898/handbook/pmd/
[0]section1/pmd143.htm.
- 6
-
B. de Finetti.
Theory of Probability: A Critical Introductory Treatment,
volume 1.
Wiley, New York, 1974.
- 7
-
T. G. Dietterich.
Machine learning research: Four current directions.
Artificial Intelligence Magazine, 18(4):97-136, 1997.
- 8
-
U. Fayyad, G. Piatetsky-Shapiro, and P. Smyth.
Knowledge discovery and data mining: Towards a unifying framework.
In Second International Conference on Knowledge Discovery and
Data Mining, 1996.
- 9
-
G. W. Flake, S. Lawrence, and C. L. Giles.
Efficient identification of web communities.
In Sixth International Conference on Knowledge Discovery and
Data Mining, pages 150-160, 2000.
- 10
-
R. Forsythe and R. Lundholm.
Information aggregation in an experimental market.
Econometrica, 58(2):309-347, 1990.
- 11
-
R. Forsythe, F. Nelson, G. R. Neumann, and J. Wright.
Anatomy of an experimental political stock market.
American Economic Review, 82(5):1142-1161, 1992.
- 12
-
R. Forsythe, T. A. Rietz, and T. W. Ross.
Wishes, expectations, and actions: A survey on price formation in
election stock markets.
Journal of Economic Behavior and Organization, 39:83-110,
1999.
- 13
-
S. French.
Group consensus probability distributions: A critical survey.
Bayesian Statistics, 2:183-202, 1985.
- 14
-
J. M. Gandar, W. H. Dare, C. R. Brown, and R. A. Zuber.
Informed traders and price variations in the betting market for
professional basketball games.
Journal of Finance, LIII(1):385-401, 1998.
- 15
-
C. Genest and J. V. Zidek.
Combining probability distributions: A critique and an annotated
bibliography.
Statistical Science, 1(1):114-148, 1986.
- 16
-
R. D. Hackathorn.
Web Farming for the Data Warehouse: Exploiting Business
Intelligence and Knowledge Management.
Morgan Kaufmann, 1998.
- 17
-
R. Hanson.
Decision markets.
IEEE Intelligent Systems, 14(3):16-19, 1999.
- 18
-
R. D. Hanson.
Could gambling save science? Encouraging an honest consensus.
Social Epistemology, 9(1):3-33, 1995.
- 19
-
E. H. Kaplan and S. J. Garstka.
March Madness and the office pool.
Management Science, 47(3):369-382, 2001.
- 20
-
M. L. Lee, W. Ling, and W. L. Low.
Intelliclean: A knowledge-based intelligent data cleaner.
In Sixth International Conference on Knowledge Discovery and
Data Mining, pages 290-294, 2000.
- 21
-
D. S. McKay, E. K. G. Jr., K. L. Thomas-Keprta, H. Vali, C. S. Romanek, S. J.
Clemett, X. D. F. Chillier, C. R. Maechling, and R. N. Zare.
Search for past life on Mars: Possible relic biogenic activity in
Martian meteorite alh84001.
Science, 273:924-930, Aug. 1996.
- 22
-
D. M. Pennock, S. Lawrence, C. L. Giles, and F. Å. Nielsen.
The power of play: Efficiency and forecast accuracy in web market
games.
Technical Report 2000-168, NEC Research Institute, 2000.
- 23
-
D. M. Pennock, S. Lawrence, C. L. Giles, and F. Å. Nielsen.
The real power of artificial markets.
Science, 291:987-988, February 9 2001.
- 24
-
C. R. Plott.
Markets as information gathering tools.
Southern Economic Journal, 67(1):1-15, 2000.
- 25
-
C. R. Plott and S. Sunder.
Efficiency of experimental security markets with insider information:
An application of rational-expectations models.
Journal of Political Economy, 90(4):663-98, 1982.
- 26
-
C. R. Plott and S. Sunder.
Rational expectations and the aggregation of diverse information in
laboratory security markets.
Econometrica, 56(5):1085-1118, 1988.
- 27
-
C. R. Plott, J. Wit, and W. C. Yang.
Parimutuel betting markets as information aggregation devices:
experimental results.
Technical Report Social Science Working Paper 986, California
Institute of Technology, Apr. 1997.
- 28
-
F. Provost and V. Kolluri.
A survey of methods for scaling up inductive algorithms.
Data Mining and Knowledge Discovery, 3(2):131-169, 1999.
- 29
-
P. Resnick and H. R. Varian.
Recommender systems.
Communications of the ACM, 40(3):56-58, 1997.
- 30
-
R. N. Rosett.
Gambling and rationality.
Journal of Political Economy, 73(6):595-607, 1965.
- 31
-
B. J. Sherrick, P. Garcia, and V. Tirupattur.
Recovering probabilistic information from options markets: Tests of
distributional assumptions.
Journal of Futures Markets, 16(5):545-560, 1996.
- 32
-
W. W. Snyder.
Horse racing: testing the efficient markets model.
Journal of Finance, 33(4):1109-1118, 1978.
- 33
-
R. H. Thaler and W. T. Ziemba.
Anomalies: Parimutuel betting markets: Racetracks and lotteries.
Journal of Economic Perspectives, 2(2):161-174, 1988.
- 34
-
D. A. Wasserman.
More than enough answers to questions nobody asked about F1Pick6,
1996.
http://www.freenet.edmonton.ab.ca/~davidwss/
[0]f1p6anal.pdf.
- 35
-
M. Weitzman.
Utility analysis and group behavior: An empirical study.
Journal of Political Economy, 73(1):18-26, 1965.
- 36
-
R. L. Winkler and A. H. Murphy.
Good probability assessors.
J. Applied Meteorology, 7:751-758, 1968.
Extracting Collective Probabilistic Forecasts from Web Games
This document was generated using the
LaTeX2HTML translator Version 2K.1beta (1.48)
Copyright © 1993, 1994, 1995, 1996,
Nikos Drakos,
Computer Based Learning Unit, University of Leeds.
Copyright © 1997, 1998, 1999,
Ross Moore,
Mathematics Department, Macquarie University, Sydney.
The command line arguments were:
latex2html -split 0 market-sim-kdd-final.tex
The translation was initiated by David Pennock on 2001-08-02
Footnotes
- ... (IEM),
- http://www.biz.uiowa.edu/iem/. Other election markets have opened in
Canada (http://esm.ubc.ca/) and Austria (http://ebweb.
[0]tuwien.
[0]ac.at/
[0]apsm/).
- ... (HSX)
- http://www.hsx.com/
- ... Ebay
- http://www.ebay.com/
- ...
Inc.
- http://www.entdata.com/
- ...
returns.
- Although cash holdings do accrue interest on HSX,
all analyses in this paper ignore any time value of Hollywood
dollars.
- ... millions).
- Movies released on holiday
weekends, and movies with substantial box office receipts prior to
wide release, may adjust differently.
- ...
(FX).
- http://www.ideafutures.com/
- ... outcomes.
- http://www.motorsport.com/compete/p6/
- ... data.
- We employ a standard least-squares regression to
obtain the best-fit line. Since the variance of data increases with
estimate magnitude, a weighted least-squares regression may be
appropriate. Ideally, weights would be inversely proportional to
variance [5], but we do not have enough data
to accurately assess variance at each point.
- ... Mojo.
- http://boxofficemojo.com/
- ... prior.
- Note that the expectation of the
Beta distribution,
 , does not coincide precisely with the
observed frequency,
, does not coincide precisely with the
observed frequency,  , where
  is the number of successes and
 the number of trials. However, as grows, the two measures
converge.
the number of trials. However, as grows, the two measures
converge.
- ... (HSBR),
- http://www.hsbr.net/
- ... 2001.
- Data for the remaining
9 races was missing.
- ... (10-6-4-3-2-1)
- We call this ``F1
style'' scoring because F1 drivers accumulate points toward their
season championship according to the same scheme. Also, F1P6 players
receive points in this manner.
- ... F1
- http://atlasf1.com/
- ... F1.
- http://galeforcef1.com/
- ...
2001.
- As of this writing, archive odds from the most recent
two races were not publicly available from Atlas F1.
- ... discovered
- http://www.ideosphere.com/fx-bin/Claim?claim=XLif
David Pennock
2001-08-02