NEC Research Institute Technical Report #2000-168.
A brief version appears in Science 291:
987-988, February 9 2001 (Letters).
The Power of Play: Efficiency and Forecast Accuracy in Web Market Games
David M. Pennock
NEC Research Institute
4 Independence Way
Princeton, NJ 08540 USA
dpennock@research.nj.nec.com
voice: 609-951-2715
fax: 609-951-2488
Steve Lawrence
NEC Research Institute
4 Independence Way
Princeton, NJ 08540 USA
lawrence@research.nj.nec.com
C. Lee Giles
School of Information Sciences and Technology and
Department of Computer Science and Engineering
Pennsylvania State University
504 Rider Building, 120 South Burrowes Street
University Park, PA 16801 USA
giles@ist.psu.edu
Finn Årup Nielsen1
Informatics and Mathematical Modelling
Technical University of Denmark, Building 321
DK-2800 Lyngby, Denmark
fn@imm.dtu.dk
Abstract:
We analyze the efficiency and forecast accuracy of two market games on
the World Wide Web: the Hollywood Stock Exchange (HSX) and the
Foresight Exchange (FX). We quantify the degree of arbitrage
available on HSX, and compare with a real-money market of a similar
nature.
We show that prices of HSX movie stocks provide good forecasts of
actual box office returns, and that prices of HSX securities in Oscar,
Emmy, and Grammy award outcomes constitute accurate assessments of the
actual likelihoods that nominees will win. Similar investigations
reveal that FX securities prices serve as reliable indicators of
uncertain future events.
We argue that, in certain circumstances, market simulations can
furnish some of the same societal benefits as real markets, and can
serve as acceptable substitute testbeds for conducting experiments
that would otherwise be difficult or impossible.
- Keywords:
- analysis of artificial markets, World Wide Web market
games, market simulations, forecast accuracy, economic efficiency,
arbitrage, Hollywood Stock Exchange, Foresight Exchange, utility for
intangibles
Introduction
The core service of a market is to facilitate the exchange of items
between individuals.
The use of prices for these items, denominated in a common
currency (e.g., US dollars), simplifies trading across multiple
markets, alleviating the combinatorial nature of direct barter. Prices
reflect an agreement between buyers and sellers, and serve as a
quantitative measure of the value of the item being exchanged, as
compared to other marketable items.
When markets attract broad participation, prices can encode the sum
total of a large amount of disparate and distributed information. The
prices reflect, in a very real sense, the consensus opinion of a myriad
of informed and well-motivated traders. As such, even nonparticipating
observers may stand to benefit from the informational value of market
signals. As an example, the odds in a horse race, determined solely by
market forces at the track, can be viewed as assessments of the
likelihoods that the various horses will win. Empirical studies verify
that odds on horses do indeed match very closely with their observed
frequencies of winning
[1,18,19,20,22].
As traditional markets expand onto electronic platforms, and as new
electronic marketplaces emerge, price information will be available and
accessible in quantities previously unimaginable. Nevertheless, markets
will still only cover a miniscule fraction of arenas for which informed
forecasts might be valuable or interesting. Many barriers exist for the
establishment of new markets, including high costs, government
regulation, and the threat of lawsuits.
Artificial markets, on the other hand, suffer from no such
difficulties. Web market games, in particular, often feature moderate
operating costs for setup, maintenance, advertising, searching, and
transacting, and benefit from worldwide audience potential. Permission
is not required from government authorities or regulatory officials.
Lawsuits are much less of a concern. There is little need for
carefully crafted disclaimers or facilities for dispute
resolution. Users can remain anonymous, and record keeping can be
somewhat lax. All of these factors have contributed to a growing
prevalence of market games on the web, some enjoying widespread
popularity. Of course, artificial markets cannot satisfy societal
demand for the exchange of items. However, in this paper we present
evidence that some market simulations can function reasonably well in
the dual role as aggregators and disseminators of information.
Theories of market equilibrium, including the rational expectations
theory of information propagation, usually depend on the assumption
that participants maximize expected utility, where utility is derived
from consumables or monetary equivalents. Indeed, laboratory economics
experiments in which subjects are not ``paid to play'' are often
questioned on the grounds of a lack of true incentives. In a game
without monetary backing, utility is presumably extracted solely from
entertainment value, educational value, bragging rights, and/or other
intangible sources. Does market efficiency simply break down under
these conditions, or can non-monetary rewards actually drive price
coherence, information aggregation, and forecast accuracy? We find
evidence that, in some cases, they can and they do. In
Section 3 we quantify price coherence on the
Hollywood Stock Exchange (HSX). Equivalent portfolios trade at
reasonably consistent prices, and, over time, large inefficiencies
disappear, as players presumably take advantage. In
Section 4 we evaluate the collective competence of
traders on HSX and on the Foresight Exchange (FX), by measuring the
prescient value of market prices. In doing so, we find
that HSX stock prices are reliable indicators of what movies will do
well at the box office,
that HSX award option prices provide accurate assessments of which
nominees will likely win entertainment awards,
and that FX prices constitute accurate probabilistic judgments for a
variety of uncertain future events.
An economist strolling down Wall Street spots a twenty dollar bill
lying on sidewalk, but decides not to pick it up. No, this particular
economist is not simply too rich to be bothered. Rather, he concludes
without checking that the bill is a forgery. ``If it were a real
twenty dollar bill,'' he reasons, ``someone else would have picked it
up already.'' This widely told joke exemplifies what is called the
efficient markets hypothesis. Roughly speaking, the hypothesis
claims that there are no free lunches in the financial markets: every
potential profit comes with some amount of risk, and prices are
inherently unpredictable. If there is a risk-free profit momentarily
available, or if prices are predictable, then someone will take
advantage of the opportunity almost instantly, exploiting it until it
is gone. There are various forms of the efficient markets hypothesis,
and at least four different degrees of efficiency to consider:
- Internal coherence: prices are self-consistent or
arbitrage-free: no trader can make a sure profit without any risk.
- Internal unpredictability: future prices are not
predictable based on current and past prices. Also called the weak
form of the efficient markets hypothesis.
- Unpredictability: future prices are not predictable based
on any currently available information, including prices, economic
variables, fundamental data, etc. Also called the semi-strong form of
the efficient markets hypothesis.
- Expert-level accuracy: Prices fully reflect all
information available to all traders. Informed experts cannot
consistently outperform naive traders. In particular, when prices
constitute forecasts, market estimates are at least as accurate as
expert assessments. Also called the strong form of the efficient
markets hypothesis.
Economists have developed a large body of theory to account for all
four levels of market efficiency. And empirical evidence
verifies--for the most part--that markets are indeed largely absent
of arbitrage, are highly unpredictable, and can yield extremely
accurate forecasts.
In this paper, we examine artificial markets for the same signs of
efficiency, focusing on the first and fourth types: internal coherence
and expert-level accuracy. We survey additional background material on
these two forms of efficiency in Sections 2.1.1
and 2.1.2, respectively.
Internal Coherence: No-Arbitrage
Almost all economic theories of equilibrium assume, at a minimum, that
equivalent portfolios are priced consistently with one another, such
that arbitrage opportunities do not exist
[2,3,11].2
Many important results of financial economics are based squarely on
the hypothesis of no arbitrage, and it serves as one of the most basic
unifying principles of the study of financial markets. [21]
For example, if the same company's stock is listed on both the Tokyo
and New York stock exchanges, then the two prices should be the same
at all times, modulo the exchange rate and transaction costs. If the
prices do ever diverge significantly, traders will purchase the stock
in the cheaper market and immediately sell it in the more expensive
market, thereby driving the two prices back together. As a second
example, monetary exchange rates should never be such that a ``round
trip'' from one currency through one or more others and back again
yields a positive gain.
A third example arises in the context of a securities
market. In the parlance of economic theory, a security is
defined as a lottery ticket that pays off $1 contingent on the
outcome of some uncertain event. For example, the owner of a security
``$1 if and only if it rains tomorrow'' will be paid $1 if it rains
tomorrow, and nothing otherwise.3 Now imagine a market of two
disjoint and exhaustive securities: ``$1 if and only if it rains
tomorrow'' and ``$1 if and only if it does not rain
tomorrow''. Owning both securities guarantees the holder a payoff of
exactly $1 regardless of whether it rains. Thus the total price to
buy both securities should never dip below $1--otherwise, the buyer
can obtain a risk-free profit. Similarly, in the absence of arbitrage,
the total price to sell both securities can never exceed $1.
We will examine a fourth example in Section 2.2, where
no-arbitrage implies that prices of a stock and its corresponding
options must conform to a relationship called put-call parity.
Expert-Level Forecast Accuracy: Rational Expectations
The theory of rational expectations (RE) equilibrium accounts
for expert-level forecast accuracy in securities markets. RE theory
posits that prices are not only coherent, but also reflect the sum
total of all information available to all market participants
[6,10]. Even when some agents have exclusive access
to inside information, prices equilibrate exactly as if everyone had
access to all information. The procedural explanation is that prices
reveal to the ignorant agents any initially private information; that
is, agents learn by observing prices. Several authors show that, if
agents begin with identical priors and disparate evidence, repeated
observation of some aggregate statistic (e.g., price) will converge to
a consensus on posteriors, for various sufficient statistics
[7,12,13,14].
Plott et al. [15] investigate, in a laboratory
setting, whether parimutuel markets (the type employed at horse races)
are able to aggregate information, as postulated by RE theory. In one
set of experiments, each subject was given inside knowledge that a
subset of horses would definitely not win. Although all subjects
were uncertain as to the outcome, their collective information was
enough to identify the winning horse with certainty. Information
aggregation did occur, and RE-based predictions fit the data well.
In earlier work, Plott and Sunder [16,17]
conducted laboratory experiments to test the reasonableness of the RE
assumption in the context of a securities market. Subjects were
initially unaware which of three states would occur.
In one study [16], privileged insiders were given
categorical knowledge of the underlying state. The RE model's
predictions--that equilibrium prices and other economic variables
converge as if everyone were aware of the true state--were
significantly more accurate than those of other models, including the
classical Walrasian hypothesis that agents do not revise their beliefs
based on prices. When insiders were given less than certain
information, the results were not definitive. In a second study
[17], insiders were told only that one of the three
states would not occur. The combined knowledge of all subjects
was sufficient to logically infer the true state, though no single
insider could directly do so. It was found that, in a complete market
of three securities, the RE predictions were again the most accurate.
In a single security market,
the RE equilibrium was not realized. On the other hand, even in this
last condition, Forsythe and Lundholm [4], with a
similar experimental design, found that RE was verified as long as
subjects were sufficiently experienced and knowledgeable.
Beyond the controlled setting of the laboratory, empiricists have
analyzed the forecast accuracy of public markets. Perhaps the most
direct tests involve horse race betting markets. Several studies
demonstrate that odds on horses correlate well with the actual
frequencies of victory
[1,18,19,20,22]. There does appear
to be a small but consistent bias: favorites are underpriced and
longshots are overpriced. Weitzman [22] and Ali
[1] show how an assumption that the crowd as a whole is
risk-seeking can explain this favorite-longshot bias. Beyond horse
racing, sports betting markets as a whole provide very accurate
forecasts of likely game outcomes.
The Iowa Electronic Market
(IEM)4 supports
trading in securities tied to the outcome of political and financial
events. Their 1988 market, open only to University of Iowa students
and employees,
offered securities that paid off proportionally to the percentage of
votes received by various candidates in that year's US Presidential
election. The final prices matched Bush's final percent margin of
victory more closely than any of the six major polls
[5]. Since opening to the public, subsequent US
Presidential election markets have attracted wide participation and
following. Other election markets have now opened in
Canada5 and Austria.6
The Hollywood Stock Exchange
The Hollywood Stock Exchange (HSX)7
is a popular online market simulation, with approximately 400,000
registered accounts. New accounts begin with H$ two million in
``Hollywood dollars''. Participants can buy and sell movie stocks,
star bonds, movie options, and award options. The current top
portfolio is worth just over H$1 billion. High ranking portfolios are
actually sold at auction on Ebay8
for real money on a regular basis. Based on these sales, the
``exchange rate'' seems to be approximately H$1 million to US$1,
with the rate increasing for higher ranked portfolios. HSX is
beginning to offer new investment opportunities backed with real
money. For example, HSX investors could purchase shares in the movie
American Psycho for H$1 million each; these shares paid off
about US$1 for every US$5 million of the movie's box office
proceeds. HSX cofounder Max Keiser hosts a weekly radio broadcast in
Los Angeles, and appears regularly on NBC's Access Hollywood to
discuss HSX information. HSX also sponsors a booth at the Sundance
Film Festival, and holds an annual Oscar party in Hollywood. Media
reports suggest that HSX prices are taken seriously by some Hollywood
insiders.
Although the current price of any HSX movie stock is based on the
collective whims of HSX traders, the value of the stock is ultimately
grounded in the corresponding movie's performance at the box
office. Specifically, after the movie has spent four weeks in release,
the stock delists and cashes out: shareholders receive H$1 per share
for every US$1 million that the movie has grossed up to that point in
the US domestic market, as reported by ACNielsen EDI,
Inc.9 Traders buy (resp., short
sell) stocks that they believe underestimate (overestimate) the
movie's eventual performance. The current price, then, is a collective
forecast of the movie's four-week box office
returns.10
The prices of some stocks adjust after their first weekend in wide,
national release. On Friday, trading in the stock is halted; on
Sunday, the price adjusts to H$2.9 times the movie's weekend box
office numbers (in US$ millions).11 In this case, the stock's price
prior to wide release is the HSX traders' forecast of 2.9 times the
movie's opening weekend proceeds. The 2.9 factor is meant to project
the movie's four week total based on its opening weekend results.
HSX often offers call and put options in nationally released
movies. Each option has an associated (constant) strike price  ,
which is a crude estimate of the movie's opening weekend return
,
which is a crude estimate of the movie's opening weekend return
 . On the Friday of opening weekend, options trading is halted; on
the following Monday, call options delist and cash out at a price
equal to the weekend proceeds (in millions) minus the strike price, or
zero if this quantity is negative (i.e.,
. On the Friday of opening weekend, options trading is halted; on
the following Monday, call options delist and cash out at a price
equal to the weekend proceeds (in millions) minus the strike price, or
zero if this quantity is negative (i.e.,
![$\max[0, r - k]$](img6.png) ). Put
options cash out at
). Put
options cash out at
![$\max[0, k - r]$](img7.png) . A high call price (resp., a high
put price) suggests that, according to HSX participants, the movie
will earn more (less) than the strike price during its opening
weekend.
. A high call price (resp., a high
put price) suggests that, according to HSX participants, the movie
will earn more (less) than the strike price during its opening
weekend.
The payoff structure of HSX movie options is analogous to so-called
European options in the financial markets. In an arbitrage-free
market, when a movie stock, a call option, and a put option are all
available for the same movie, the three prices must conform to a
relationship called put-call parity:
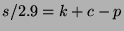 , where
  ,
,
,
,  , and
, and  are the stock, strike, call, and put prices,
respectively. Consider the value of the following two portfolios: (1)
twenty nine call options plus H$29 in cash, and (2) twenty nine
put options plus 10 shares of the stock. After the weekend, portfolio
1 will be worth
are the stock, strike, call, and put prices,
respectively. Consider the value of the following two portfolios: (1)
twenty nine call options plus H$29 in cash, and (2) twenty nine
put options plus 10 shares of the stock. After the weekend, portfolio
1 will be worth
![$29k + 29\max[0, r-k] = \max[29k, 29r]$](img11.png) while
portfolio 2 will be worth
while
portfolio 2 will be worth
![$\max[0, k-r] + 10(2.9r) = \max[29r,
29k]$](img12.png) . Since the two portfolios pay off equivalently, their prices at
any time before the weekend should be equal; otherwise, a trader can
buy the cheaper portfolio and short sell the other, locking in a
guaranteed profit.12
. Since the two portfolios pay off equivalently, their prices at
any time before the weekend should be equal; otherwise, a trader can
buy the cheaper portfolio and short sell the other, locking in a
guaranteed profit.12
Occasionally, HSX offers securities (which they call award options)
associated with particular awards ceremonies--for example, the 72nd
Annual Academy Awards, or Oscars, sponsored by the Academy of
Motion Picture Arts and Sciences. Five options, corresponding to the
five award nominees, are available within each award category (for
example, Oscar award options were available for each of the eight
major Oscar categories of best picture, best actor, best actress, best
supporting actor, best supporting actress, best director, best
original screenplay, and best adapted screenplay). Within each
category, the winning option cashes out at H$25, and the other four
cash out at H$0. Before awards are announced, an option's price can
be interpreted as its estimated likelihood of winning. For example,
when Kevin Spacey's price was twice that of Denzel Washington, the
consensus of HSX opinions was that Spacey was roughly twice as likely
to win as Washington. By normalizing prices within each category,
likelihoods can be converted into probabilities. Notice that, since it
is certain that one and only one of the five options within a
particular category will pay off H$25, the bundle price of all five
options should be worth H$25 at all times. If the combined price ever
dips below H$25, a participant could guarantee an arbitrage profit by
purchasing all five and waiting (if necessary) until the winner is
announced, at which time he or she can pocket the difference. If the
combined price ever moves above H$25, participants can guarantee a
profit by short selling all five options.
Internal Coherence in Artificial Markets
In a real market, monetary incentives are the driving force behind
efficiency and, in particular, internal price coherence. In an
artificial market, on the other hand, there are no direct monetary
incentives. When an arbitrage loophole presents itself in a
simulation, why should anyone care to take advantage of it? Incentives
must come from intangible sources (e.g., the desire to perform well in
the game) or from indirect sources (e.g., the desire to do well enough
to sell one's portfolio on Ebay). Do HSX players have utility for
Hollywood dollars and, if so, are their resulting incentives strong
enough to maintain internal price consistency in the game?
To analyze these questions, we quantify the degree of coherence in the
HSX stock and options markets (Section 3.1), and
in the HSX award options market
(Section 3.2).
Put-Call Parity
We test how closely HSX stock and options prices conform to put-call
parity. We gathered weekend halt prices (i.e., prices after Friday's
halt and before the weekend adjust) for 75 movie stocks and their
corresponding options appearing on HSX during the period of March 3,
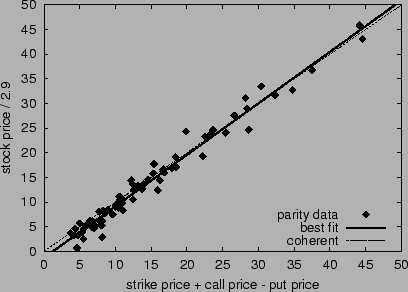
2000 to September 1, 2000. Figure 1 graphs the
stock estimate of weekend box office returns ( ) versus the
options estimate (
) versus the
options estimate ( ). In an arbitrage-free market, the two
estimates must be the same. The figure demonstrates a reasonably close
adherence to put-call parity at price halt. The correlation between
the two estimates is 0.989, the slope of the best-fit line to the data
(the solid line in the figure) is 1.04, and the mean difference
between estimates is 1.35. Any point in the figure not lying on the
line
). In an arbitrage-free market, the two
estimates must be the same. The figure demonstrates a reasonably close
adherence to put-call parity at price halt. The correlation between
the two estimates is 0.989, the slope of the best-fit line to the data
(the solid line in the figure) is 1.04, and the mean difference
between estimates is 1.35. Any point in the figure not lying on the
line  (the dashed line) indicates a potential arbitrage
opportunity. Since HSX restricts each player's investment to a maximum
of 10,000 shares of any option, exploiting all of these inefficiencies
averages about H$13,500 per movie--a relatively small, though
non-negligible, amount in terms of the game.
(the dashed line) indicates a potential arbitrage
opportunity. Since HSX restricts each player's investment to a maximum
of 10,000 shares of any option, exploiting all of these inefficiencies
averages about H$13,500 per movie--a relatively small, though
non-negligible, amount in terms of the game.
Figure 1:
Put-call parity in the HSX stock and options markets at
price halt. Points plot versus for each movie.
The dashed line where corresponds to perfect
parity; the solid line is the best linear fit.
 |
In an efficient market, prices should adhere to put-call parity at
all times, not just at price halt. Moreover, any movements away from
parity that do occur should revert rather quickly, as participants
take advantage of arbitrage opportunities. We test these hypotheses by
measuring the divergence from parity over time, and the likelihood of
closure toward parity. For each stock and its corresponding options,
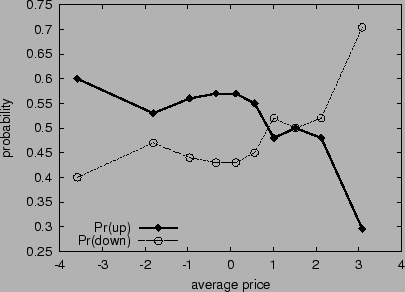
we recorded the quantity 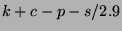 every four hours. This quantity
is the divergence from parity, or the available arbitrage per option
share, or the price of a portfolio of H$1 cash, one call option, a
short position in one put option, and a short position in
every four hours. This quantity
is the divergence from parity, or the available arbitrage per option
share, or the price of a portfolio of H$1 cash, one call option, a
short position in one put option, and a short position in  stocks. We sorted the resulting 971 portfolio prices, and grouped them
into ten buckets: nine buckets with exactly 100 portfolios each, and
the last with the remaining 71. Within each bucket, we computed the
fraction of portfolios that were observed at a higher price four hours
later, and the fraction of portfolios that were lower in price four
hours later. Figure 2 graphs the frequency of
upward and downward movements versus the average price. Points marked
as diamonds indicate the frequency of an upward shift at the next time
step, given the average current price; points marked as circles
indicate the frequency of a downward shift at the next time step,
given the average current price. The market is not completely free of
arbitrage--prices diverge at times from parity by as much as
H$6.5. Nevertheless, the market does exhibit signs of internal
coherence. When prices are too high, they are much more likely go down
at the next time step as, presumably, participants take advantage of
arbitrage opportunities. When prices are too low, they are more likely
to increase. Large deviations from coherent prices might be partially
explained by trading limits of 10,000 option shares per person, so
that even astute and ``wealthy'' investors cannot fully exploit
arbitrage windows.
stocks. We sorted the resulting 971 portfolio prices, and grouped them
into ten buckets: nine buckets with exactly 100 portfolios each, and
the last with the remaining 71. Within each bucket, we computed the
fraction of portfolios that were observed at a higher price four hours
later, and the fraction of portfolios that were lower in price four
hours later. Figure 2 graphs the frequency of
upward and downward movements versus the average price. Points marked
as diamonds indicate the frequency of an upward shift at the next time
step, given the average current price; points marked as circles
indicate the frequency of a downward shift at the next time step,
given the average current price. The market is not completely free of
arbitrage--prices diverge at times from parity by as much as
H$6.5. Nevertheless, the market does exhibit signs of internal
coherence. When prices are too high, they are much more likely go down
at the next time step as, presumably, participants take advantage of
arbitrage opportunities. When prices are too low, they are more likely
to increase. Large deviations from coherent prices might be partially
explained by trading limits of 10,000 option shares per person, so
that even astute and ``wealthy'' investors cannot fully exploit
arbitrage windows.
Figure 2:
Arbitrage closure toward put-call parity in the HSX stock
and options markets. Each diamond point (resp., circle point)
displays the fraction of portfolios that move up (down) in price
after four hours, versus the average current price.
 |
Award Options
In this section, we analyze price coherence in the HSX award options
market. In an efficient market, the combined price for a bundle of
options in the same award category would remain at H$25 at all
times. We examine the actual prices of options in the Oscar and Emmy
awards markets for deviations from H$25, and for the likelihood of
closure toward H$25. We recorded the sum of the five options within
each category every four hours from March 3 to September 1, 2000. We
sorted the resulting 1895 bundle prices, and merged them into ten
buckets: nine buckets with exactly 200 bundles each, and the last with
the remaining 95. Within each bucket, we computed the fraction of
bundles that were observed at a higher price four hours later, and the
fraction of bundles that were lower in price four hours later.
Figure 3 graphs the frequency of upward
and downward movements versus the average price.
Prices diverge at times from H$25 by close to 40%, yet a clear trend
is evident whereby highly underpriced and overpriced bundles are
likely to revert toward the coherent price. Notice that the crossover
point, where up and down swings are equally likely, occurs above
H$25. We postulate that this is because participants generally prefer
to buy rather than to sell short.
Figure 3:
Arbitrage closure in the HSX Oscar and Emmy options
markets. Each diamond point (resp., circle point) displays the
fraction of bundles that move up (down) in price after four hours,
versus the average current price.
![\begin{figure}
\begin{center}
\centerline{\scalebox{0.75}{\epsfig{file=hsx-a...
...udegraphics[width=14cm]{hsx-oscar-arbitrage.eps}
\end{center}
\end{figure}](img18.png) |
Figure 4:
Arbitrage closure in the IEM NY Senate market.
![\begin{figure}
\begin{center}
\centerline{\scalebox{0.75}{\epsfig{file=iem-n...
...udegraphics[width=14cm]{hsx-oscar-arbitrage.eps}
\end{center}
\end{figure}](img19.png) |
For comparison, we conducted a similar arbitrage analysis using data
from the Iowa Electronic Market (IEM), a real-money exchange offering
securities in political events. We obtained daily closing prices for
the NY Senate market, still in progress as of this
writing. Participants can buy or sell shares of six securities:
``US$1 if and only if Hillary Clinton wins the election'', ``US$1 if
and only if another Democrat wins'', ``US$1 if and only if Rick Lazio
wins'', ``US$1 if and only if Rudy Giuliani wins'', ``US$1 if and
only if another Republican wins'', and ``US$1 if and only if any
other candidate wins''. In order for the market to be arbitrage free,
the sum of the bid prices of the six securities cannot exceed US$1,
and the sum of the ask prices cannot fall below US$1. We did not have
access to bid and ask prices, so we performed the calculations using
the last transaction prices; this provides an upper bound on the
amount of arbitrage in the market. We sorted bundles by price and
grouped them into buckets. We computed the fraction of bundles in each
bucket that were up the next day, and the fraction that were down.
Figure 4 displays the results. Maximum
deviations from US$1 were approximately 6%. Low prices were very
likely to move upward the next day, high prices very likely to turn
back downward. Interestingly, the crossover point is still above
US$1, suggesting that perhaps even in IEM there is a preference for
buying over selling. There are also effective trading limits in IEM,
since participants can join the market with a maximum US$500
investment. Comparing Figures 3
and 4, it is clear that IEM prices are more
coherent than HSX prices, as one might expect, given that the former
is grounded in real money while the latter is not. Nevertheless, the
general shape of the two plots are similar.
Forecast Accuracy in Artificial Markets
Internal price coherence is one, fairly minimal, standard of market
efficiency. Stronger forms of efficiency imply market competence as
well and coherence: prices actually reflect an aggregation of
information distributed among the participants, and market forecasts
are as accurate as expert assessments. While coherence in artificial
markets is of academic interest, competence in artificial markets
promises real societal benefits in the form of cheap and reliable
forecasts. We now examine whether this stronger notion of efficiency
can hold in market games, by assessing the forecast accuracy of the
HSX stock and options markets (Section 4.1),
the HSX award options market
(Section 4.2), and the Foresight Exchange
market (Section 4.3).
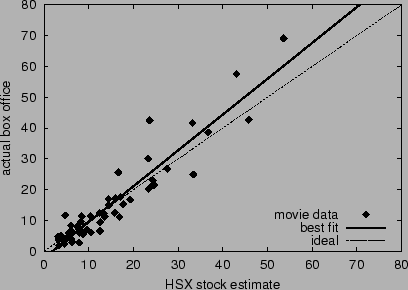
Box office forecasts: HSX movie stocks and options
Before a movie stock on HSX adjusts, its price constitutes an estimate
of 2.9 times the movie's opening weekend proceeds. We gathered the
halt prices  (Friday morning's prices) and adjust prices
  (2.9 times the actual return) for movies opening during the period
March 3, 2000 to September 1, 2000. We also collected the published
forecasts of Brandon Gray at Box Office Mojo.13 We quantify and compare HSX predictions to
Box Office Mojo predictions for 50 movies appearing on both sources.
Figure 5 plots the actual box
office return
(2.9 times the actual return) for movies opening during the period
March 3, 2000 to September 1, 2000. We also collected the published
forecasts of Brandon Gray at Box Office Mojo.13 We quantify and compare HSX predictions to
Box Office Mojo predictions for 50 movies appearing on both sources.
Figure 5 plots the actual box
office return  versus the HSX estimate
  for each
movie. The correlation between actual and estimate is 0.940. The slope
of the best-fit line to the data (the solid line in the figure) is
1.16, the mean absolute error is 3.57, and the mean percent error is
31.5%.
for each
movie. The correlation between actual and estimate is 0.940. The slope
of the best-fit line to the data (the solid line in the figure) is
1.16, the mean absolute error is 3.57, and the mean percent error is
31.5%.
Figure 5:
Accuracy of HSX movie stock forecasts for opening
weekend box office returns. The dashed line corresponds to ideal accuracy;
the solid line is the best linear fit.
 |
The HSX options market provides an alternative forecast for opening
weekend returns. The quantity  , where
  and
and  are
the call and put halt prices, should coincide with , due to
put call parity. When actual returns are plotted against this options
estimate, the correlation is 0.931, the best-fit line's slope is 1.12,
the mean absolute error is 3.38, and the mean percent error is 47.0%.
are
the call and put halt prices, should coincide with , due to
put call parity. When actual returns are plotted against this options
estimate, the correlation is 0.931, the best-fit line's slope is 1.12,
the mean absolute error is 3.38, and the mean percent error is 47.0%.
Notice that for both stock and options estimates, there is a slight
bias to underprice the best-performing movies and overprice the
worst-performing movies. This may be explainable as a manifestation of
risk-seeking behavior among HSX participants: traders prefer potential
``sleepers'' with a low probability of a very large payoff, rather
than known quantities with a high probability of a moderate
payoff. Since payoffs are not in real money, and since motivations may
be to sell out on Ebay, or to get onto the leader board quickly, one
might expect to see risk-seeking behavior.
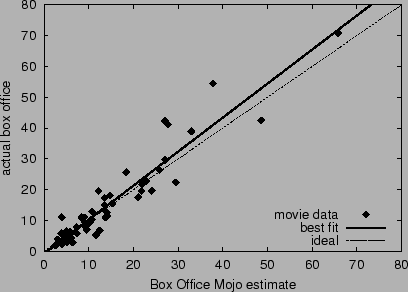
Figure 6 displays actual returns
versus Box Office Mojo forecasts.14
The correlation is 0.945, the best-fit line's slope is 1.10, the mean
absolute error is 3.31, and the mean percent error is 27.5%. Box
Office Mojo performed only 4% better than HSX stocks in terms of mean
percent error. The correlation in errors between HSX estimates and Box
Office Mojo estimates is 0.818, suggesting that the two estimates may
result from overlapping sources of evidence. In fact, it is possible
that Box Office Mojo observes HSX prices, and/or that some HSX traders
read Box Office Mojo forecasts.
Figure 6:
Accuracy of Box Office Mojo forecasts for opening
weekend returns. The dashed line corresponds to ideal accuracy;
the solid line is the best linear fit.
 |
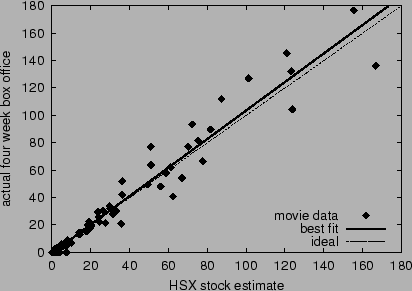
After a movie stock adjusts (or if it does not adjust), its price is a
forecast of the movie's four week total box office return  . We
gathered the delist prices and the prices three weeks before
delist
. We
gathered the delist prices and the prices three weeks before
delist  for 109 movies between March 3, 2000 to September 1,
2000. Figure 7 graphs
versus for each movie. The correlation is 0.978, the best-fit
line's slope is 1.04, and the mean error is 4.01.
for 109 movies between March 3, 2000 to September 1,
2000. Figure 7 graphs
versus for each movie. The correlation is 0.978, the best-fit
line's slope is 1.04, and the mean error is 4.01.
Figure 7:
Accuracy of HSX movie stock forecasts for four week total
box office returns. The dashed line corresponds to ideal
accuracy; the solid line is the best linear fit.
 |
Probabilistic forecasts: HSX Award Options
In the HSX Oscar options market, as it turns out, each nominee with
the highest final price in its category did indeed win an Oscar. The
Wall Street Journal, amid controversy, published a poll of actual
Academy voters days before the Oscar awards ceremony; their report
correctly forecasted only seven out of eight winners.
Beyond predicting the most likely winner, we investigate how
accurately HSX award option prices reflect all likelihoods of
winning. For example, if prices are accurate, then among all options
with a normalized price of H$0.1, about one in ten should end up
winning. Our accuracy analysis is similar to that conducted for horse
races [1,18,19,20,22] and other
sports betting markets involving real money. We collected prices of
award options associated with the Oscars,
Grammies, and Emmies, for a total of
135
options. Grammy options (nine categories) and Emmy options (ten
categories) functioned exactly as Oscar options, though winning Grammy
options paid out H$42 instead of H$25.
Figure 8:
Accuracy of the HSX award options market. Points display
observed frequency versus average normalized price for buckets of
similarly-priced options. The dashed line where frequency equals
price corresponds to ideal accuracy.
![\begin{figure}
\begin{center}
\centerline{\scalebox{0.75}{\epsfig{file=hsx-a...
...udegraphics[width=14cm]{hsx-oscar-arbitrage.eps}
\end{center}
\end{figure}](img32.png) |
Prices were recorded just before the markets closed, and before
winners were announced. We sorted the options by price, and grouped
them into six buckets. We placed the same number of options (16)
in every bucket, under the constraint that every bucket include at
least one winning option. We computed the average normalized price of
options within each bucket, and the observed frequency within
each bucket, or the number of winning options divided by the number of
options. Figure 8 plots each
bucket's observed frequency versus its average normalized price. If we
model options as independent Bernoulli trials, then, in the limit as
the number of options goes to infinity, completely accurate prices
would imply that bucket points fall on the line , where observed
frequency equals price. Error bars display 95% confidence intervals
under the independent Bernoulli trials assumption. Specifically, the
lower error bound is the 0.025 quantile of a Beta distribution
corresponding to the observed number of successes (wins) and trials in
the bucket, and the upper error bound is the 0.975 quantile. The Beta
distribution is the correct posterior distribution over frequency,
assuming a uniform prior.15 The length of an error bar decreases as the number of
options in the bucket increases. The independence assumption is an
idealization, since options within a single award category are
actually mutually exclusive. The closeness of fit to the line
can be considered a measure of the accuracy of HSX prices.
There is some indication of a favorite-longshot bias, although more
data is needed to verify. As in horse racing, this bias is potentially
explainable by assuming risk-seeking behavior among the participants.
We compare HSX prices of Oscar options to reported likelihood
assessments from five columnists at the Hollywood Stock Brokerage and
Resource (HSBR),16 a fansite of
HSX. We use the logarithmic scoring rule to rate the market and the
columnists. The logarithmic score is a proper scoring rule
[23], and is an accepted method of evaluating probability
assessors. When experts are rewarded according to a proper score, they
can maximize their expected return by reporting their probabilities
truthfully. Additionally, more accurate experts can expect to earn a
higher average score than less competent experts. Scores are computed
separately within each award category, then averaged. Index the five
nominees in a category
 . Let
. Let  if and only if
the
if and only if
the  th nominee wins, and
  otherwise. let
 be the market's or columnist's reported probabilities for the
five nominees. Then the assessor's score for the current category is
be the market's or columnist's reported probabilities for the
five nominees. Then the assessor's score for the current category is
 . Expert assessments were
reported on February 18,
2000. Table 1 gives the average
scores for the HSX market, the five columnists, and the consensus of
the columnists. Higher scores are better, with 0 the maximum and
negative infinity the minimum. Only one of the five experts scored
appreciably better than the market on February 18. HSX's score
increased almost continuously from the market's open on February 15 to
the market's close on March 26. By February 19, the market's score had
surpassed all of the scores for all five experts and for their
consensus.
. Expert assessments were
reported on February 18,
2000. Table 1 gives the average
scores for the HSX market, the five columnists, and the consensus of
the columnists. Higher scores are better, with 0 the maximum and
negative infinity the minimum. Only one of the five experts scored
appreciably better than the market on February 18. HSX's score
increased almost continuously from the market's open on February 15 to
the market's close on March 26. By February 19, the market's score had
surpassed all of the scores for all five experts and for their
consensus.
Table 1:
Evaluation of HSX Oscar forecasts and
HSBR columnists' forecasts, according to average logarithmic score.
Higher (less negative) scores are better.
| assessor |
score |
| Feb 18 HSX prices |
-1.08 |
| Feb 19 HSX prices |
-0.854 |
| Tom |
-1.08 |
| Jen |
-1.25 |
| John |
-1.22 |
| Fielding |
-1.04 |
| DPRoberts |
-0.874 |
| columnist consensus |
-1.05 |
|
Foresight Exchange
Hanson [8,9] proposes what he calls an
Idea Futures market, where participants trade in securities
that pay off contingent on future developments in science, technology,
or other arenas of public interest. For example, a security might pay
off US$1 if and only if a cure for cancer is discovered. He argues
that the reward structure of such a market encourages honest
revelation of opinions among scientists, and provides more accurate
probability assessments for use by funding agencies, public policy
leaders, the media, and other interested parties. The concept is
operational as a web game called the Foresight Exchange
(FX).17 There are
currently on the order of 3000 registered participants and 200 active
claims. Players start with an initial amount of ``FX bucks'' and
receive an allowance every week, up to a certain maximum. Participants
can buy and sell existing claims, or submit their own claims. Each
claim is assigned a judge to arbitrate ambiguous wording, and to
ultimately determine whether the claim is true or not on the judgment
date. Claims range from technical (e.g., FX$1 if and only if an
algorithm for three satisfiability is developed with a particular
runtime complexity by the year 2020) to sociopolitical (e.g., FX$1 if
and only if Japan possesses nuclear missiles by 2020) to irreverent
(e.g, FX$1 if and only if Madonna names her first child Jesus). The
developers of the site intend for the prices of these claims to be
interpreted as assessments of the probabilities of the various events.
Figure 9:
Accuracy of the Foresight Exchange market. Prices are 30
days before claim expiration. Points display observed frequency
versus average price. The dashed line corresponds to ideal
accuracy.
![\begin{figure}
\begin{center}
\centerline{\scalebox{0.75}{\epsfig{file=if-ac...
...udegraphics[width=14cm]{hsx-oscar-arbitrage.eps}
\end{center}
\end{figure}](img42.png) |
To determine how accurate these assessment are, we collected
historical price information for all retired (completed) claims as of
September 8, 2000. Of these, we retained only the 172 that were binary
(i.e., paid off if and only if some true-or-false event occurred).
We recorded the price of each claim 30 days before it expired. A total
of 161 claims were active for at least 30 days, and thus qualified for
this data set. We sorted the claims by their 30-day-before-expiration
price, grouped them into six buckets of constant size 17 (under the
constraint that every bucket contain at least one winning claim), and
computed the average price and observed frequency for each bucket.
Figure 9
graphs the results.
Error bars show 95% confidence intervals based on the assumption that
claims are independent Bernoulli trials with a uniform prior over
frequency.
The World Wide Web fosters large-scale group activities of all sorts,
from competing in games, to trading in markets, to competing in market
trading games.
But beyond their entertainment value, are there any societal benefits
to artificial markets? Despite their lack of grounding in tangible
assets, both the Hollywood Stock Exchange (HSX) and the Foresight
Exchange (FX) show signs of efficiency, manifested as price coherence
and forecast accuracy. In absolute terms, HSX provides informative box
office forecasts, while both HSX and FX provide prescient likelihood
assessments of uncertain events. In direct and limited comparisons
with expert judges, both types of HSX forecasts perform
competitively. Relative to a real-money market, arbitrage closure on
HSX appears qualitatively similar, though quantitatively much weaker.
What are the implications of these results? For one, interested
parties can mine existing market simulations for information, with
some reassurance as to accuracy. Alternatively, they can open new
artificial markets, with relatively few impediments, as a mechanism
for gathering information in areas of personal concern or
interest. Economics researchers may also open market games in order to
carry out experiments that would otherwise be too costly or too
difficult. The analyses bear upon the psychology of incentives for
intangibles, and begin to investigate what is needed, at a minimum, in
order for beneficial economic properties to emerge from group
interactions.
We thank William Walsh, Michael Wellman, Yan Chen, and Chris Meek for
advice, insightful comments, and pointers to related work. Thanks to
Eric Glover for research and programming assistance. Thanks to James
Pancoast and ``Jimmy Impossible'' from the Hollywood Stock Brokerage
and Resource (http://www.hsbr.net/), a fansite of HSX, and to
Ken Kittlitz from the Foresight Exchange.
- 1
-
Mukhtar M. Ali.
Probability and utility estimates for racetrack bettors.
Journal of Political Economy, 85(4):803-816, 1977.
- 2
-
Kenneth J. Arrow.
The role of securities in the optimal allocation of risk-bearing.
Review of Economic Studies, 31(2):91-96, 1964.
- 3
-
Jacques H. Dreze.
Market allocation under uncertainty.
In Essays on Economic Decisions under Uncertainty, pages
119-143. Cambridge University Press, 1987.
- 4
-
Robert Forsythe and Russell Lundholm.
Information aggregation in an experimental market.
Econometrica, 58(2):309-347, 1990.
- 5
-
Robert Forsythe, Forrest Nelson, George R. Neumann, and Jack Wright.
Anatomy of an experimental political stock market.
American Economic Review, 82(5):1142-1161, 1992.
- 6
-
Sanford J. Grossman.
An introduction to the theory of rational expectations under
asymmetric information.
Review of Economic Studies, 48(4):541-559, 1981.
- 7
-
Robin Hanson.
Consensus by identifying extremists.
Theory and Decision, 44(3):293-301, 1998.
- 8
-
Robin Hanson.
Decision markets.
IEEE Intelligent Systems, 14(3):16-19, 1999.
- 9
-
Robin D. Hanson.
Could gambling save science? Encouraging an honest consensus.
Social Epistemology, 9(1):3-33, 1995.
- 10
-
Robert E. Lucas.
Expectations and the neutrality of money.
Journal of Economic Theory, 4(2):103-24, 1972.
- 11
-
Andreu Mas-Colell, Michael D. Whinston, and Jerry R. Green.
Microeconomic Theory.
Oxford University Press, New York, 1995.
- 12
-
Richard D. McKelvey and Talbot Page.
Common knowledge, consensus, and aggregate information.
Econometrica, 54(1):109-127, 1986.
- 13
-
Richard D. McKelvey and Talbot Page.
Public and private information: An experimental study of information
pooling.
Econometrica, 58(6):1321-1339, 1990.
- 14
-
Lars Tyge Nielsen, Adam Brandenburger, John Geanakoplos, Richard McKelvey, and
Talbot Page.
Common knowledge of an aggregate of expectations.
Econometrica, 58(5):1235-1239, 1990.
- 15
-
C. R. Plott, J. Wit, and W. C. Yang.
Parimutuel betting markets as information aggregation devices:
experimental results.
Technical Report Social Science Working Paper 986, California
Institute of Technology, April 1997.
- 16
-
Charles R. Plott and Shyam Sunder.
Efficiency of experimental security markets with insider information:
An application of rational-expectations models.
Journal of Political Economy, 90(4):663-98, 1982.
- 17
-
Charles R. Plott and Shyam Sunder.
Rational expectations and the aggregation of diverse information in
laboratory security markets.
Econometrica, 56(5):1085-1118, 1988.
- 18
-
Richard N. Rosett.
Gambling and rationality.
Journal of Political Economy, 73(6):595-607, 1965.
- 19
-
Wayne W. Snyder.
Horse racing: testing the efficient markets model.
Journal of Finance, 33(4):1109-1118, 1978.
- 20
-
Richard H. Thaler and William T. Ziemba.
Anomalies: Parimutuel betting markets: Racetracks and lotteries.
Journal of Economic Perspectives, 2(2):161-174, 1988.
- 21
-
Hal R. Varian.
The arbitrage principle in financial economics.
J. Economic Perspectives, 1(2):55-72, 1987.
- 22
-
Martin Weitzman.
Utility analysis and group behavior: An empirical study.
Journal of Political Economy, 73(1):18-26, 1965.
- 23
-
Robert L. Winkler and Allan H. Murphy.
Good probability assessors.
J. Applied Meteorology, 7:751-758, 1968.
The Power of Play: Efficiency and Forecast Accuracy in Web Market Games
This document was generated using the
LaTeX2HTML translator Version 2K.1beta (1.48)
Copyright © 1993, 1994, 1995, 1996,
Nikos Drakos,
Computer Based Learning Unit, University of Leeds.
Copyright © 1997, 1998, 1999,
Ross Moore,
Mathematics Department, Macquarie University, Sydney.
The command line arguments were:
latex2html -split 0 market-sim-letter-extended.tex
The translation was initiated by David Pennock on 2001-02-17
Footnotes
- ... Nielsen1
- This work conducted while visiting the NEC Research Institute.
- ...Arrow64,Dreze87,MasColell95.2
- Pareto efficiency, a
common and mild assumption, implies no-arbitrage.
- ... otherwise.3
- Insurance contracts,
futures, options, derivatives, and even stocks can be modeled as
portfolios of such atomic securities.
- ...
(IEM)4
- http://www.biz.uiowa.edu/iem/
- ...
Canada5
- http://esm.ubc.ca
- ... Austria.6
- http://ebweb.tuwien.ac.at/apsm/
- ... (HSX)7
- http://www.hsx.com/
- ... Ebay8
- http://www.ebay.com/
- ...
Inc.9
- http://www.entdata.com/
- ...
returns.10
- Although cash holdings do accrue interest on HSX,
all analyses in this paper ignore any time value of Hollywood
dollars.
- ... millions).11
- Movies released on holiday
weekends, and movies with substantial box office receipts prior to
wide release, may adjust differently.
- ... profit.12
- In practice, the hedge is not quite so
perfect: movie options cash out based on the final box office numbers
reported on Monday, while movie stocks adjust according to the box
office estimates reported on Sunday, which are projections based on
Friday and Saturday returns only.
- ... Mojo.13
- http://boxofficemojo.com/
- ... forecasts.14
- Actual returns reported on
Box Office Mojo occasionally differed slightly from those reported on
HSX. We measured each forecaster against its own reported returns.
- ... prior.15
- Note that the expectation of the
Beta distribution,
 , does not coincide precisely with the
observed frequency,
, does not coincide precisely with the
observed frequency,  , where is the number of successes and
 the number of trials. However, as grows, the two measures
converge.
the number of trials. However, as grows, the two measures
converge.
- ... (HSBR),16
- http://www.hsbr.net/
- ...
(FX).17
- http://www.ideafutures.com/
David Pennock
2001-02-17